 Anir Suren
This is one of the coolest things I've done with Claude. You connect it straight to your Instagram, paste in one prompt, and it reads every post on your account and builds you a full creator intelligence dashboard from your real numbers. Not vibes, not guesses, your actual reach, engagement, best and worst posts, which formats are carrying you, and what to make more of.
It genuinely looks like a paid analytics product. Here's the exact one it built from my account, plus the free setup and the full prompt so you can run it on yours.
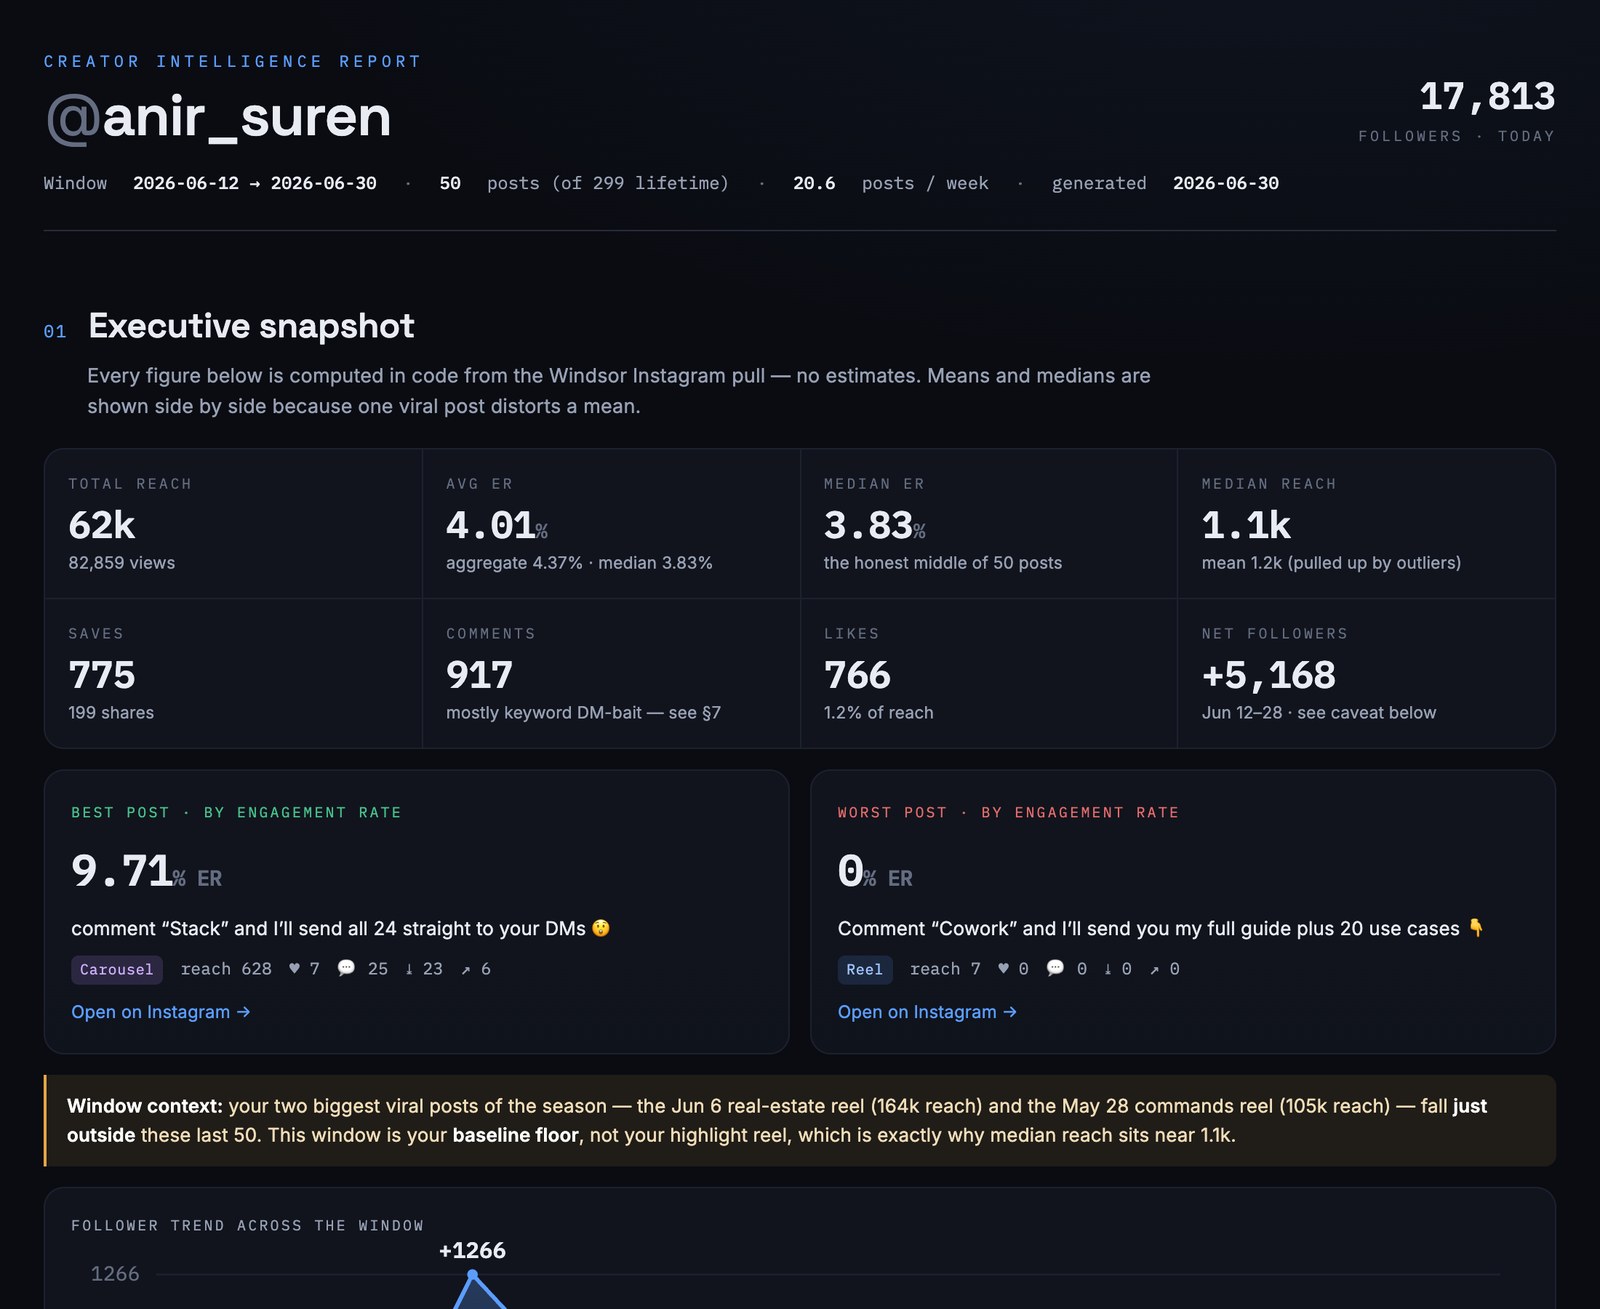
The real dashboard Claude built from my Instagram. Every number is pulled from my actual account.
How to set it up in 30 seconds
You need Claude (this works on the paid plans) and the free Windsor connector. That's it.
- Open Claude and click Customize.
- Click Connectors, hit the plus, then Browse connectors.
- Search for Windsor and hit the plus to add it.
- Open the link it gives you and connect your Instagram. Don't worry, it's completely free.
- Open a new chat and paste in the exact prompt below.
- Switch the model to Opus 4.8 on high effort, then hit send.
Claude then pulls all your real data and every post and builds the whole dashboard for you. Give it a minute, it is doing real work.
The exact prompt
Copy this word for word and paste it into a new chat after you've connected Windsor. It tells Claude everything it needs.
You have access to my Instagram account through the Windsor.ai connector (connector id: "instagram"). You are going to build me a complete creator intelligence dashboard. Treat this like a paid analytics product, depth, clarity, and honesty about the data all matter.

=== STEP 1: DISCOVER THE DATA ===
Before pulling anything, call get_fields on the "instagram" connector with no fields argument to list every available field. Then call get_options to see date ranges and any account-level options. Tell me in one line what's available and what's NOT, so I know the ceiling before you build.

=== STEP 2: PULL THE DATA ===
Pull my last 50 posts (or the max available if fewer). Get every post-level field that exists, including but not limited to: timestamp/date, post type (reel / image / carousel / video), permalink, caption, reach, impressions, likes, comments, saves, shares, total interactions/engagement, video views, plays, average watch time, and follows-from-post if available. Also pull any account-level series available: follower count over time, profile views, website/link clicks, reach by day.

Use real values only. If a field doesn't exist or returns null for a post, record it as "not available", NEVER fill it with an estimate or a plausible-looking number. Compute all derived metrics (engagement rate, save rate, etc.) in code, not by eye.

=== STEP 3: BUILD THE DASHBOARD ===
Render it as a single polished visual artifact (HTML). Make it genuinely nice to look at: clean card-based layout, clear typographic hierarchy, a restrained accent color, charts where charts help (bar, line, scatter), data tables where tables help. Dark, modern, premium feel. It should look like something I'd pay for, not a wall of text. Mobile-readable since I'll screen-record it.

Include these sections:

1. EXECUTIVE SNAPSHOT
   - Total reach and impressions across the 50 posts
   - Average engagement rate (interactions / reach, computed in code)
   - Median engagement rate too (means lie when one post goes viral)
   - Best post and worst post by engagement rate, with the thumbnail-equivalent (permalink) and key stats
   - Posting cadence: how many posts per week over the window
   - Follower trend over the window if available, net gain/loss

2. ENGAGEMENT RATE LEADERBOARD (what's working)
   - Top 10 posts ranked by ENGAGEMENT RATE, not raw likes (raw likes just reward your biggest-reach posts and hide the real winners)
   - For each: format, reach, likes, comments, saves, shares, ER, and the caption's first line / hook
   - Below the table: the 3-5 patterns these winners share. Be specific.

3. UNDERPERFORMERS (what's holding me back)
   - Bottom 10 by engagement rate
   - Same columns
   - The common threads: format, length, hook style, posting time, topic if inferable from the caption. Name the likely causes directly.

4. FORMAT INTELLIGENCE
   - Reels vs carousels vs images vs static video: count, avg reach, avg ER, avg saves, avg shares for each
   - A clear verdict: which format is carrying me, which is dead weight
   - Reach-per-format and ER-per-format as a small chart

5. THE SAVE & SHARE REPORT (the real value signal)
   - Saves and shares matter more than likes for the algorithm and for proving content worth. Rank posts by save rate and share rate.
   - What do the most-saved posts have in common? Most-shared?
   - These are my "make more of this" posts, say which ones explicitly.

6. TIMING & CADENCE
   - If timestamps allow: best-performing day-of-week and time-of-day by ER
   - Whether posting more often correlates with better or worse per-post reach in my data. State the correlation honestly, including "no clear signal" if that's the truth, don't manufacture a pattern.

7. HOOK & CAPTION TEARDOWN (only if caption text is available)
   - Look at the first line of my top vs bottom posts
   - What hook structures show up in winners? (question, bold claim, number, curiosity gap, etc.)
   - If caption text is NOT returned by the API, say so and skip this section rather than guessing.

8. 5 CONTENT TOPICS TO TEST NOW
   - Grounded in what's actually performing in MY data
   - For each topic, mark clearly: [FROM DATA] if it's a proven pattern in my numbers, or [STRATEGIC BET] if it's your inference beyond what the data proves. I need to know which is which.

9. 3 FORMATS / EXPERIMENTS FOR THE NEXT 30 DAYS
   - Specific and testable, each with the metric I'd watch to call it a win or kill it

10. THE ONE THING
   - If I could only change one thing about my content based on this entire audit, what is it and why. One paragraph. Make it sharp.

=== RULES ===
- Real numbers only. Every figure traces back to Windsor data.
- If something isn't available, say "not available from the API" in that exact spot, visible in the dashboard, not hidden.
- Compute everything in code. No mental math, no eyeballed averages.
- Don't flatter me. If my content is mediocre in a category, the dashboard should say so plainly.
- Distinguish data from inference everywhere it matters.
What it actually gives you
It reads your real posts and ranks them by engagement rate, not raw likes, so the real winners show up instead of just your biggest-reach posts. Then it tells you the patterns those winners share.
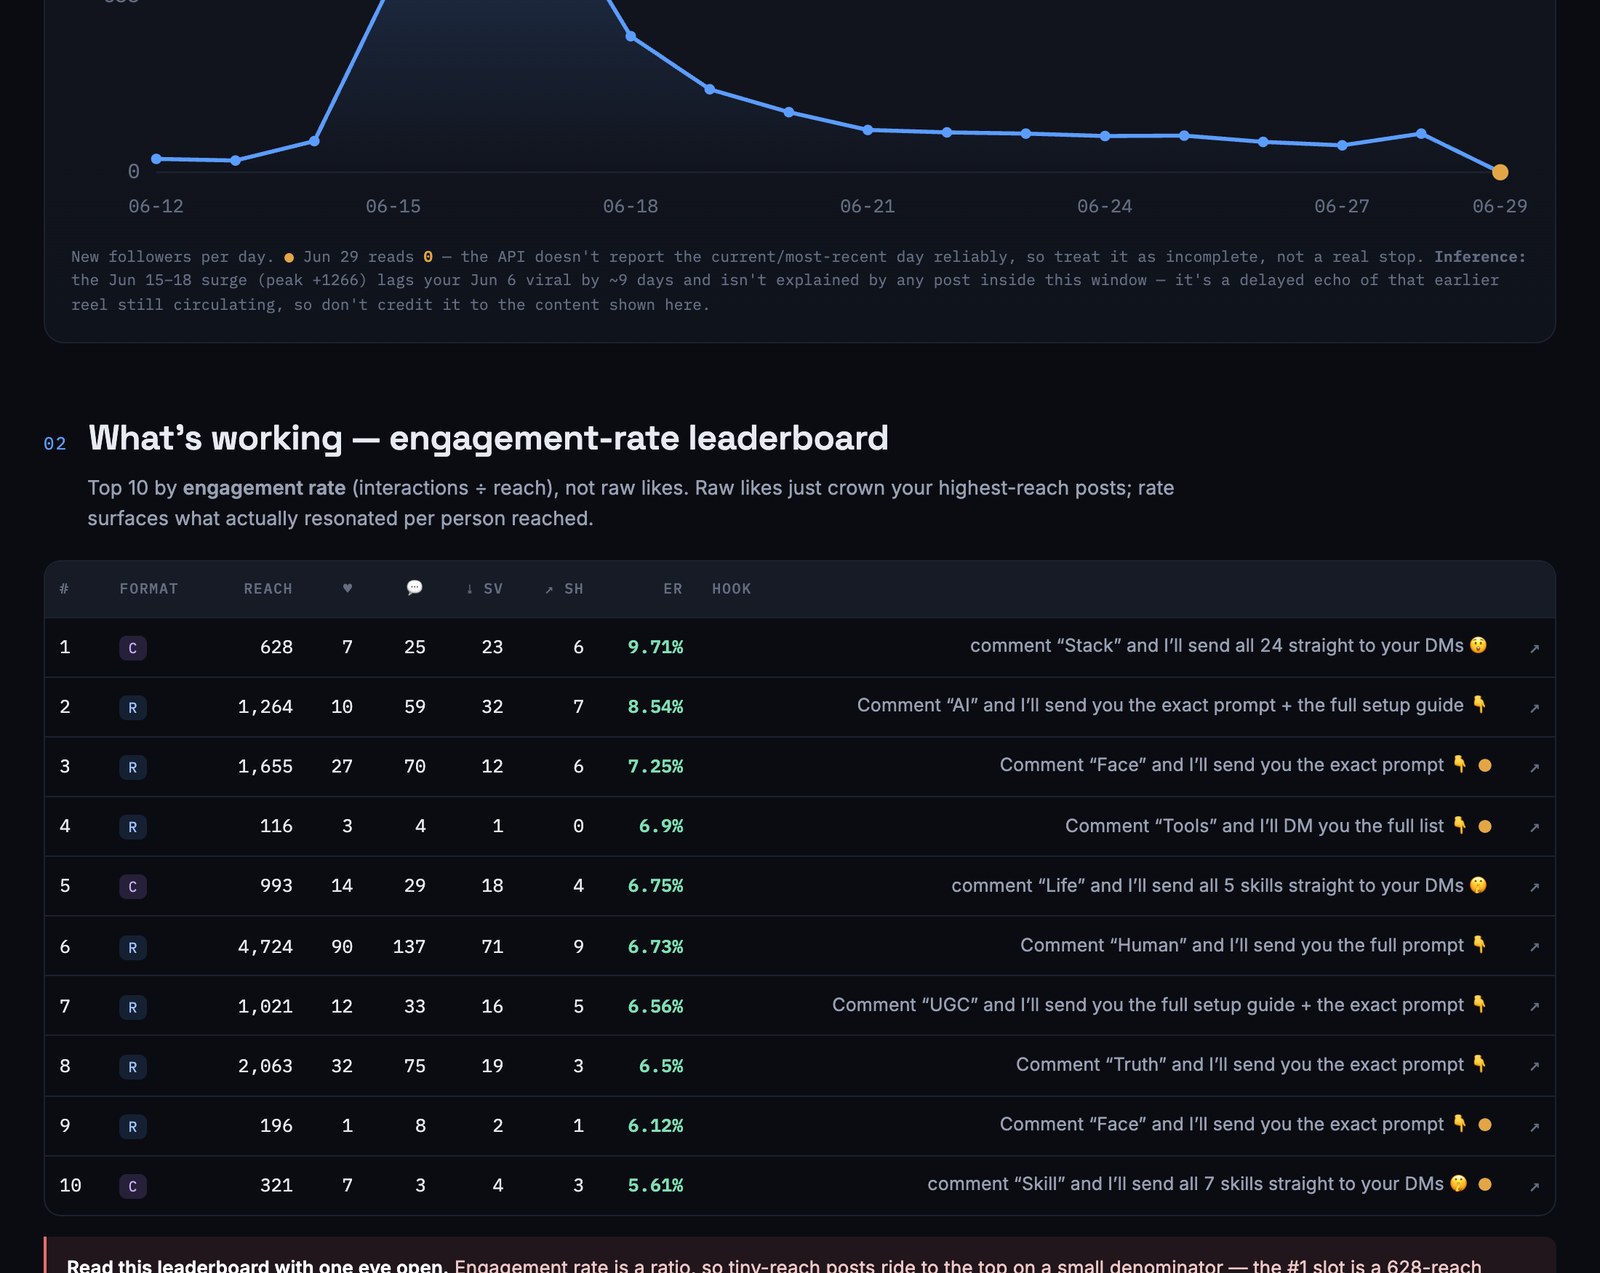
The engagement-rate leaderboard, my top posts ranked by what actually resonated per person reached.
It breaks down formats (reels vs carousels vs images), calls out which one is carrying you, and pulls the exact patterns behind your best content. Mine even caught that my carousels engage harder than my reels, which I would not have guessed.
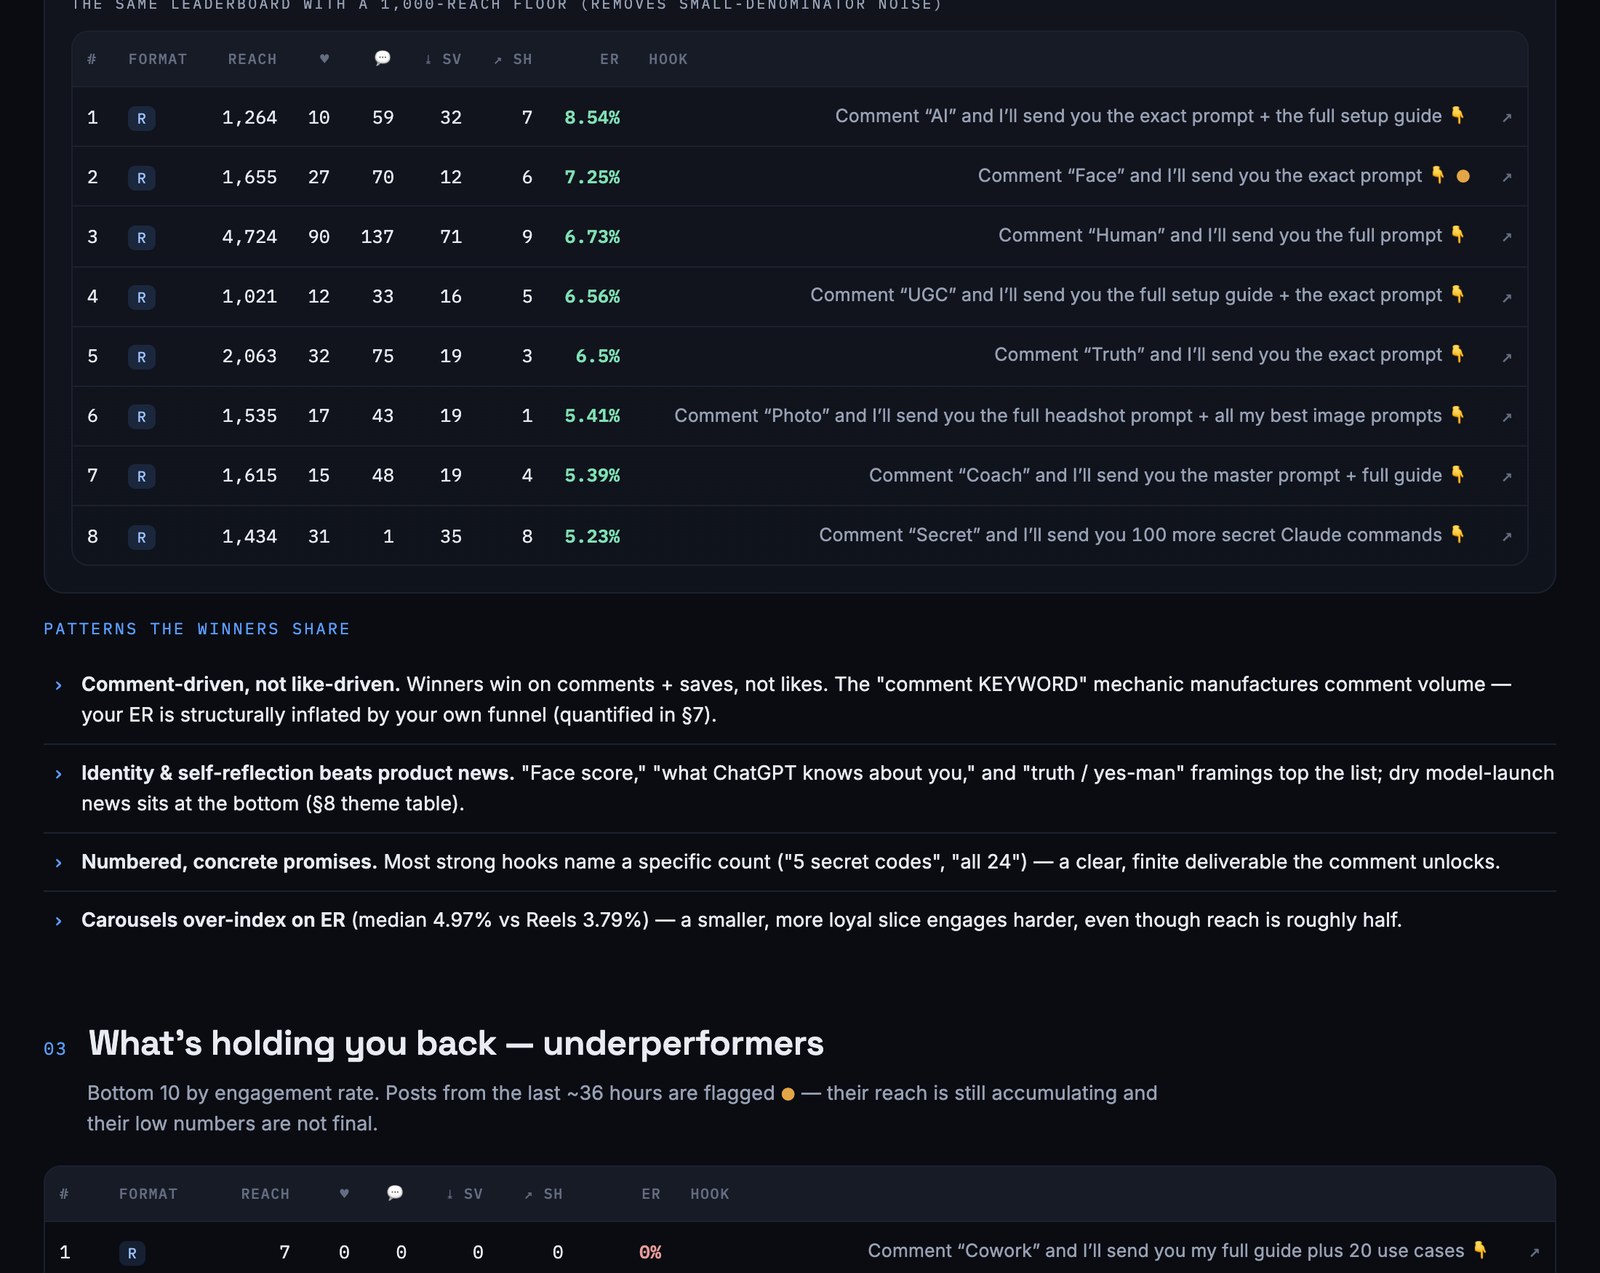
Format breakdown plus the specific patterns my winners share. This is the "make more of this" part.
The whole point is it uses your real numbers only. If the data isn't there, it says "not available" instead of making something up. That's what makes it worth trusting.
Two things to get right
- Use Opus 4.8 on high effort. This is real analysis across dozens of posts, so give it the strongest model. On a weaker model it gets lazy with the math.
- Run it every month. The value is watching the trend, which hooks keep winning, which formats fade. One snapshot is useful, a monthly one is a strategy.
Go connect it and run the prompt on your own account. Seeing your real numbers laid out like this changes how you post.
– Anir
If you want AI like this actually built into your business, apply to work with me. And to catch the next one, join the newsletter.